Introducing the new Blockchain.com monthly newsletter — April Edition: “After the Dust Settles”
Introducing the new Blockchain.com monthly newsletter — April Edition: “After the Dust Settles”

The quality of information and data in crypto has improved in recent years, so you may be asking why another monthly newsletter?
There are still some big data and analysis gaps in crypto. Crypto markets are nowhere near as widely served with reliable research and data as traditional markets. Indeed, the March 12–13th crypto stress test demonstrated there are also still some very significant issues with the state of crypto exchange infrastructure.
What you can expect from our monthly newsletter
Our intention with this newsletter is to avoid repeating what you can find elsewhere and to instead focus on giving you fresh, original insights that the Blockchain.com team and our partners are uniquely capable of providing.
Given outsized volatility in crypto and the broader financial markets (which we expect will continue), we wanted to create a way for Blockchain.com customers to regularly hear our thoughts and interact with us. Blockchain.com is one of the oldest and most trusted cryptocurrency companies, and millions of users have come to rely on us for storing and transacting digital assets. Understanding how we are measuring and assessing market conditions is important to maintaining your hard won trust.
In addition to this monthly newsletter, we have also launched regular live video chats that feature perspectives and Q&A with members of the highly experienced Blockchain.com team, including our head of research (Dr. Garrick Hileman, former University of Cambridge researcher and lecturer) and our head of markets (Charlie McGarraugh, former Goldman Sachs partner). We’ll also bring perspectives from other areas of our company, such as engineering and data (eg Peter Wilson, former Google and Amazon engineering exec), as well as interviews with other prominent voices from around the crypto ecosystem.
As this newsletter and the video chats are new initiatives for us, we very much welcome your feedback.
Thank you for taking the time to hear our thoughts on markets, and if you like this newsletter please share it.
Summary
Note: Hyperlinks direct you to each section below
1. Market Update and Positioning
- Crypto has rebounded relatively quickly from its mid-March lows and performed better than some asset classes (eg equities) for Q1
- We anticipate bitcoin (BTC) to continue to drive the overall price action in crypto, with BTC dominance potentially rising for a number of reasons
- After dropping by ~20%, bitcoin (BTC) hashrate (security) has already begun rebounding due to BTC’s price rebound and the downward difficulty adjustment
- Given current depressed price levels and the May mining reward “halving”, less efficient miners may be forced to sell more BTC
- As less efficient miners (“weak hands”) are forced to close shop between now and summer 2020, the more efficient miners (“strong hands”) that remain may face less pressure to liquidate their BTC holdings (thereby reducing downward price pressure)
3. Guest Feature by Kaiko
- Analyzing the crucial role of market makers during a price crash
4. Guest Feature by Into the Block
- The effects of the recent price drop on bitcoin (BTC) “hodl” metrics
5. History doesn’t always repeat, but it often rhymes
- Finding a perfect historical analogy for today’s pandemic is difficult, but policymakers are hauling out a very familiar playbook
- Big winners include the internet and e-commerce, remote work, and crypto
Market Update and Positioning
March was one of the most turbulent months in financial market history. Never before have so many equity markets plunged so far so fast.
For Q1 as a whole, while crypto was not spared, bitcoin (-12%) did manage to comfortably outperform equities (-21%). Both bitcoin and equities underperformed gold (+1.8%) and the US dollar (+2.6%).
Since the 13th of March bitcoin has dramatically rebounded, up +50% (Table 1).

Sources: Blockchain.com, World Gold Council, Google Finance, MarketWatch
Tactical Positioning
We anticipate bitcoin (BTC) to continue to drive the overall price action in crypto. Other notable investors in the space are also anticipating BTC dominance to rise for a number of reasons, including:
- The “digital gold” thesis and status as an emerging macro hedge
- Maturity level relative to younger blockchain networks that are still under significant development; other crypto networks require now harder-to-acquire development resources and bitcoin is relatively more “finished”
- Status as a ‘safe haven’ within the cryptoassets ecosystem; historically during times of crypto market stress investors have migrated their portfolios towards bitcoin
- More established institutional capital “on-ramps” as compared to other cryptoassets (eg CME futures markets, Fidelity, Bakkt, etc.)
On-Chain Happenings: interpreting the plunge in bitcoin’s hashrate, and looking ahead to the bitcoin “halving”
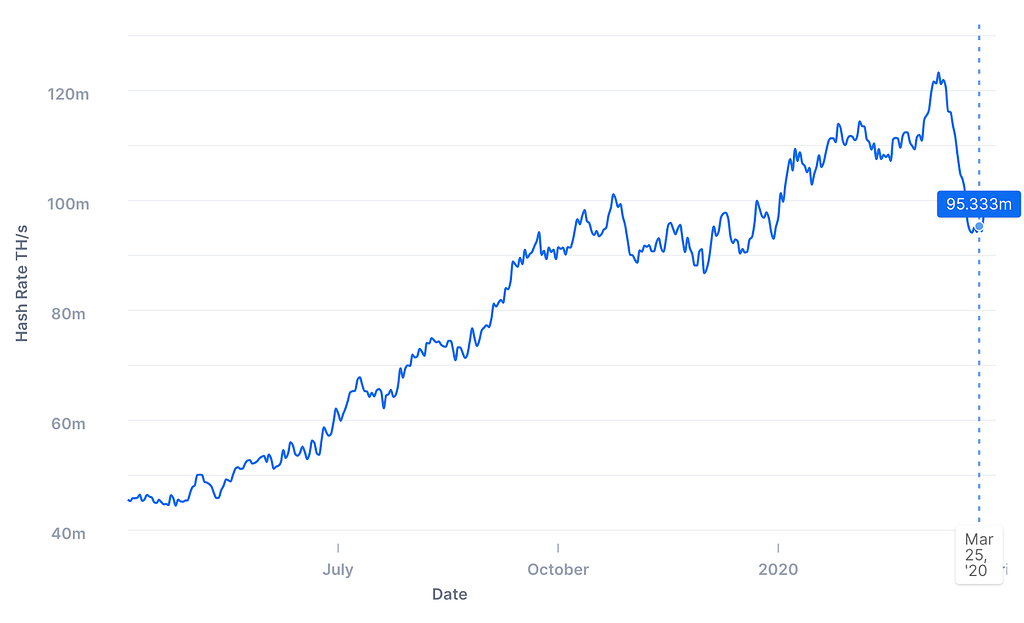
The bitcoin network recently experienced a significant decrease in mining (computing) power, almost certainly due to the decreased bitcoin price (Figure 1). A decline in bitcoin’s price makes mining less profitable and forces less efficient miners (i.e., those with higher electricity costs and/or less efficient mining hardware) to shut down their mining operation.
Figure 1: Estimated Bitcoin (BTC) Mining Hashrate
What is “hashrate” and why is it important?
Although bitcoin’s exact mining (computing) power is unknown, it is possible to estimate the computing power — the “hashrate” — from the number of blocks being mined and the current block difficulty. This estimate is displayed on Blockchain.com’s Charts page.
Mining hashrate is a key security metric: the more hashing (computing) power, the greater bitcoin’s network security (resistance to attack).
When looking at daily numbers, it may periodically rise or drop as a result of the randomness of block discovery : even with a hashing power constant, the number of blocks mined can vary in day.
Our analysts have found that looking at a 7 days average is a better representation of the underlining power, which is now the default setting of Blockchain.com’s chart. For example, the sudden drop at 75.5 TH/s on the 25th of March was a combination of a slowly decreasing power and an extremely unlucky day for miners; and looking back at the numbers, a more accurate estimate is somewhere around 95 TH/s.
What is the halving and what impact will it have on bitcoin’s price?
The “halving” is a rule coded into the bitcoin software that slashes the reward for mining bitcoin in half approximately every four years (Figure 2).
Figure 2: Bitcoin supply growth rate will be further reduced in May
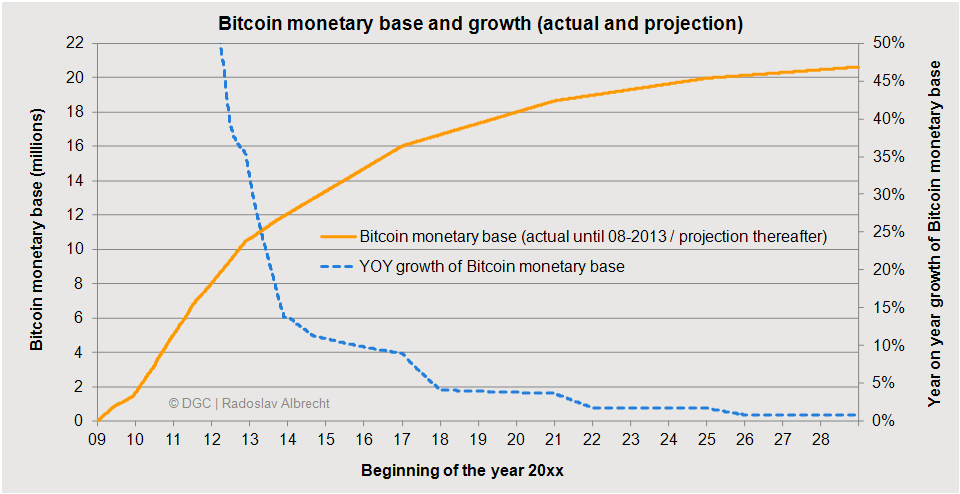
The next halving is scheduled for May of this year, when the reward will be reduced from the current 12.5 new bitcoins minted into existence every ~10 minutes down to 6.25 new bitcoins.
What impact the halving will have on bitcoin’s price is a heavily debated topic.
We anticipate additional media coverage of the halving, which should help boost web search interest in bitcoin and other metrics that have historically correlated positively with bitcoin’s price. The propensity of many bitcoin owners to hold for the long-term (“hodl”) and a reduction in supply of newly minted bitcoins may have a positive price impact on bitcoin’s supply-demand dynamics.
However, there are no guarantees that any of these past patterns will repeat in 2020. All we can say for certain is the supply of newly minted bitcoin’s will soon receive a significant reduction.
Announcing refreshed Blockchain.com charts!
As we gear up for the halving we are excited to announce that in the coming weeks, we will launch improved Blockchain.com Charts, which will feature a better user experience, as well as enhanced descriptions methodologies.

Guest Feature by Kaiko: Analyzing the crucial role of market makers during a price crash
The March 12th price crash, recently dubbed ‘Black Thursday,’ revealed both the infrastructural limits and flawed structure of cryptocurrency markets. However, the crash also highlighted areas for improvement, which could ultimately make crypto markets more sophisticated and disaster-proof.
March 12th saw one of the largest increases in trading volume and raw transaction counts in the history of cryptocurrency markets. This caught many exchanges by surprise, leading to unexpected downtime, lagging interfaces, and ultimately losses for customers who were unable to act on price movements.
March 12th also called attention to the unstable liquidity of order books on many cryptocurrency exchanges. ¹ The price crash was largely perpetuated by a collapse in order book liquidity, initiated by real selling pressure derived from global fears over Covid-19, which quickly spiraled into “mechanical” selling pressure triggered by automatic liquidations which demolished market depth, pushing down the price of Bitcoin.²
There are two key lessons to be learned from ‘Black Thursday’:
- Exchange infrastructure matters. Exchanges should be built to handle unexpected increases in trade counts and user activity. When exchanges experience downtime during a price crash, this negatively impacts the process of price discovery which has ripple effects throughout the markets.
- Market makers are important. Market makers play a crucial role in maintaining liquidity during a price crash. The initial price crash triggered a relentless negative feedback loop of automatic liquidations and collapsing market depth, which did not give market makers time to readjust their positions. Exchange’s should ensure that their order books are liquid enough to handle a rapid and unexpected increase in market orders. This requires further investment in market making capacities.
The Mechanics of A Price Crash
The price of an asset is simply the last price at which a market order (placed by a price taker) is filled by a limit order (placed by a price maker).³ During a price crash, selling pressure builds as market sell orders overwhelm the bid-side of an order book.
Imagine a wrecking ball knocking over a building — in a price crash, market sell orders can be thought of as the wrecking ball, and the bid-side of an order book as the building. Sell orders will demolish the bid-side of an order book, and in doing so push down the price of an asset.
Cryptocurrency Exchange Infrastructure
On March 12th, exchanges across the world experienced unexpected infrastructure problems as a rapid uptick in user activity caused congestion, which overwhelmed servers, slowed down interfaces, and disrupted trading. Some notable exchanges had problems during the price swings, including Bitmex, Huobi, FTX, and Gemini.
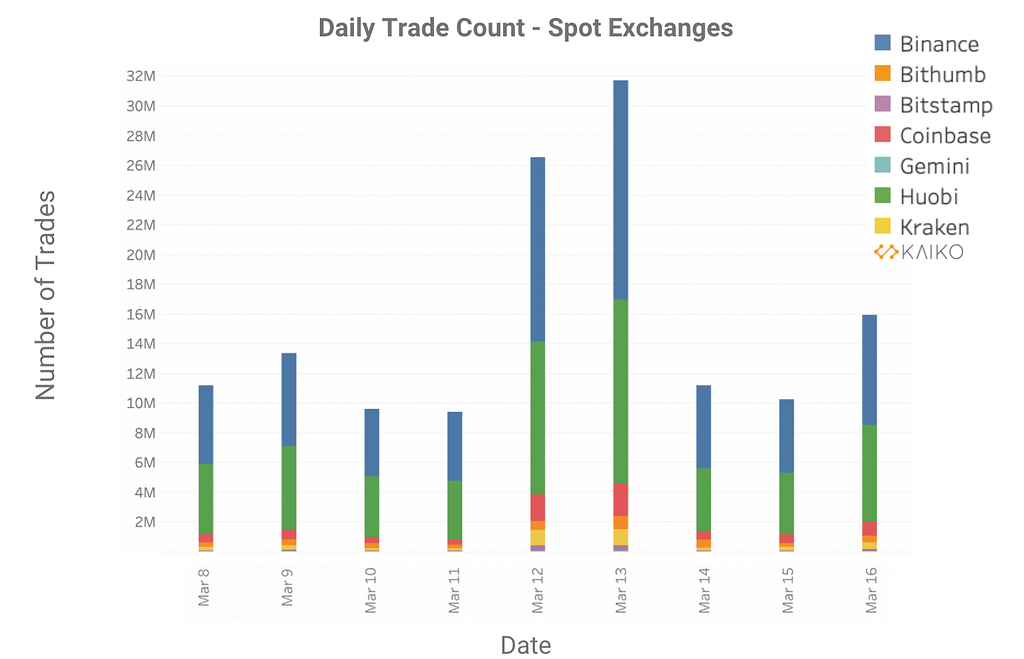
The charts below show trade count on several high volume exchanges. This metric is interesting from an infrastructural perspective: which exchanges can handle higher trade counts vs. which exchanges experienced slower processing times (or had to halt trading)?
As can be observed, trade counts on March 12th and 13th were more than twice the number of trades on the previous few days on all exchanges analyzed (Figures 3 & 4).
Figure 3: Daily Trade Count – Derivatives Exchanges
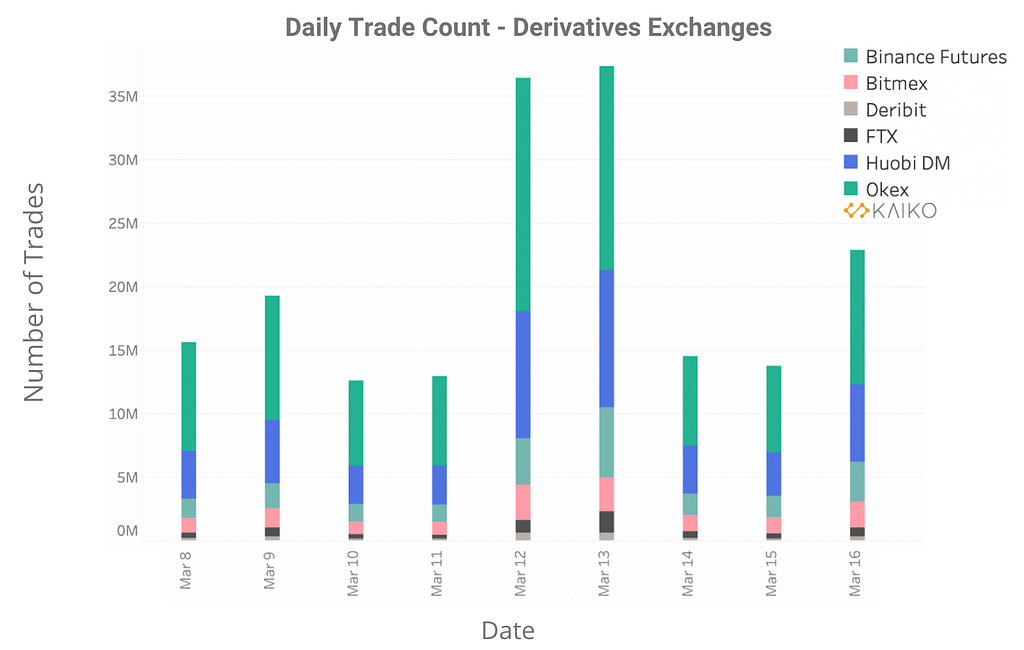
Figure 4: Daily Trade Count – Spot Exchanges
Order Books Liquidity Crisis
Exchanges across the world also experienced a crisis in liquidity as both real selling pressure and automatic liquidations overwhelmed order books.
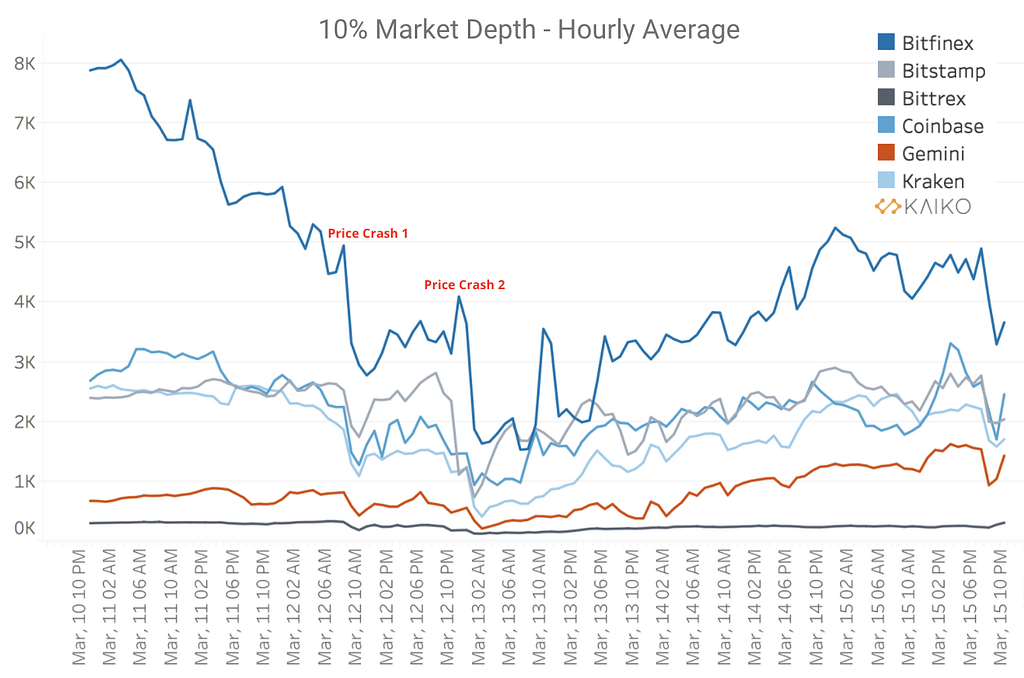
The chart below shows an aggregation of BTC/USD order books from 8 exchanges: Bitfinex, Bitflyer, Bitstamp, Coinbase, Gemini, Bittrex, Itbit, and Kraken.
As can be observed, market depth declined drastically from March 12th — March 13th as market orders stripped order books dry (Figures 5 & 6).
Figure 5: Aggregated Order Books
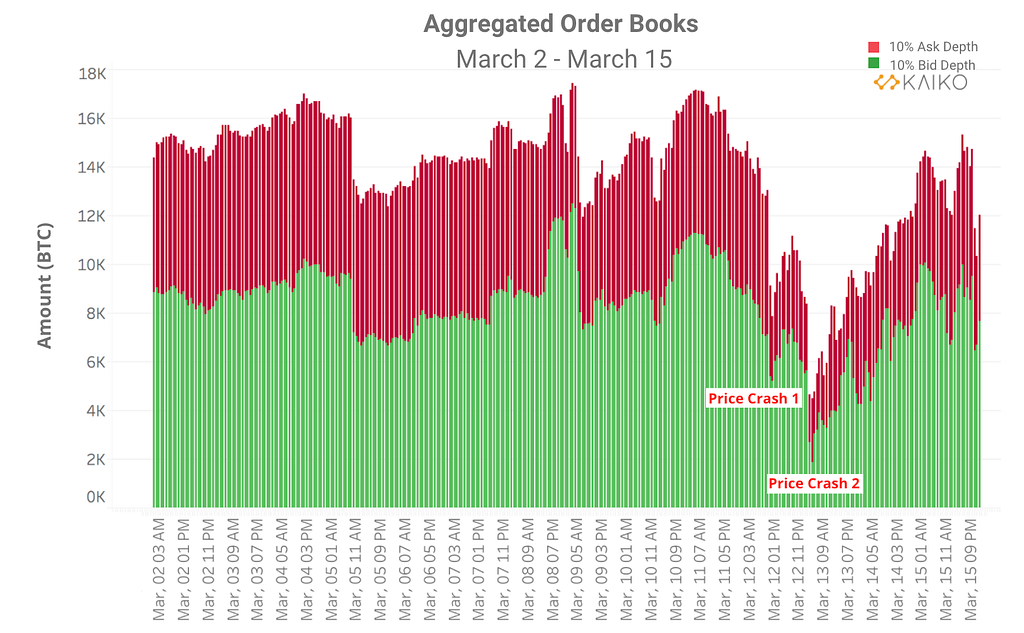
Figure 6: 10% Market Depth – Hourly Average
Guest Feature by Into the Block: The effects of the recent price drop on bitcoin (BTC) holding metrics
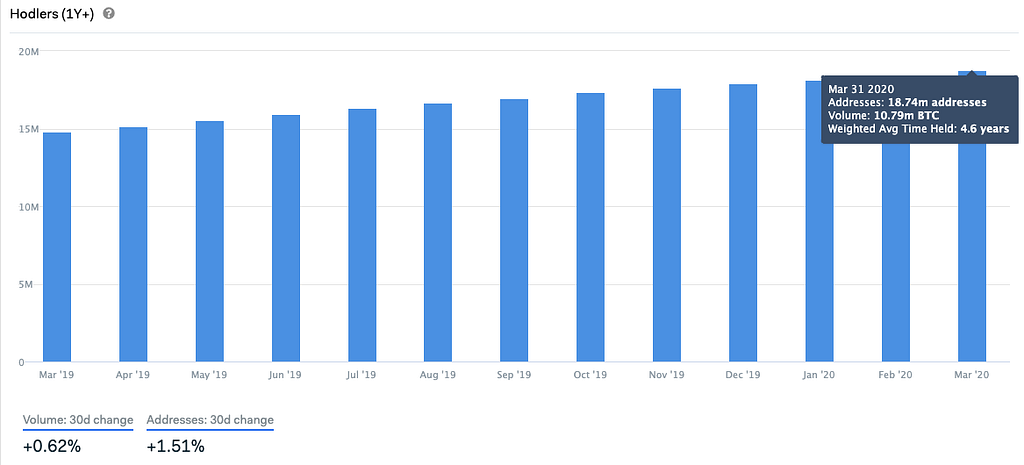
Hodlers, or addresses with a holding period of at least one year, have increased throughout March despite prices dropping ~25% (Figure 7). The volume being ‘hodled’ also managed to increase slightly, pointing to long-term investors being unaffected by the recent volatility
Figure 7: “Hodl on!” Growth in long-term holdings of Bitcoin (BTC) despite March price decline
Hodlers
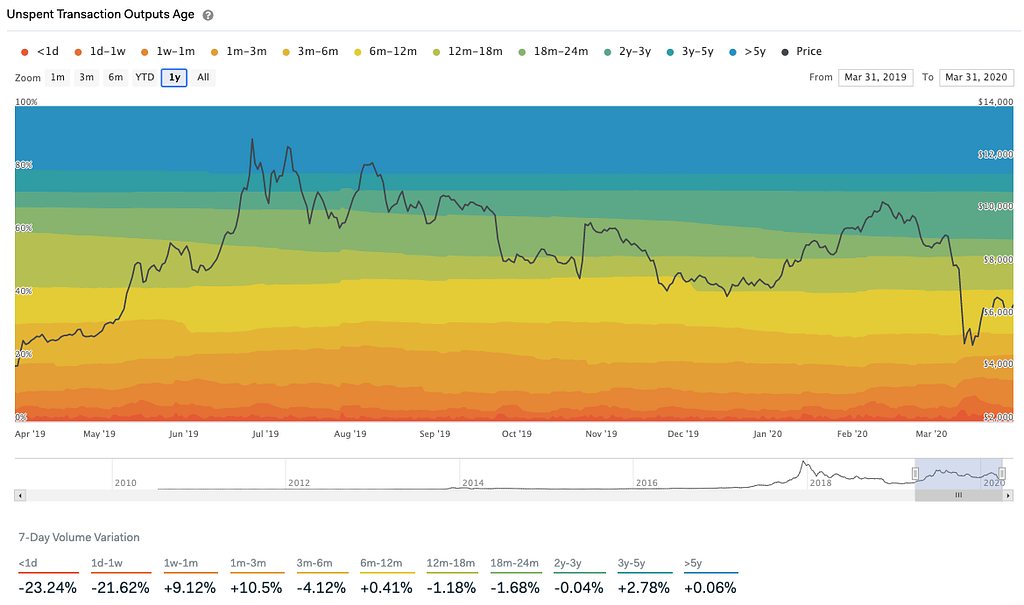
Changes in the age of unspent transaction outputs (UTXOs) show that there was an increase of 9% for the group of addresses that bought between 1 week to 1 month ago, indicating money entering the market during the recent drop (Figure 8). However, the fact that addresses with an age of less than a week dropped by over 20% points to a decreasing rate of new addresses relative to what had been seen a week ago.
Figure 8: Increases Observed in UTXO Age
Looking at addresses that are “in/out of the money” (based on time of address use and market price), 12.15 million addresses were realizing profits with their positions on March 12 vs. 13.64 million on April 1st, despite prices being slightly lower (Figure 9). This signals that over a million addresses bought during this time and at lower prices. On the other hand, there were also over a million addresses that realized their losses during this time, as shown by the decrease of addresses out of the money.
Figure 9: Historical In/Out of the Money

History doesn’t always repeat, but it often rhymes
The 1918 Influenza, the 2008 Great Financial Crisis, the Second World War — these and other significant historical episodes have recently been referenced as possible guides to how parts of the COVID-19 crisis may play out.
In unsettling and uncertain times we frequently turn to history in an effort to draw parallels and develop a “playbook” to help us navigate a crisis. However, no episode is perfectly identical to prior historical ones no matter how similar they may appear. It is therefore important to exercise caution around over-analogizing with past events.
“Unlimited”, “radical”, “infinite”
While there is much still to learn about how the COVID-10 triggered crisis will unfold, there are two important facts we have to work with today:
- The response by governments and centrals banks already totals trillions of dollars of fiscal stimulus and monetary support
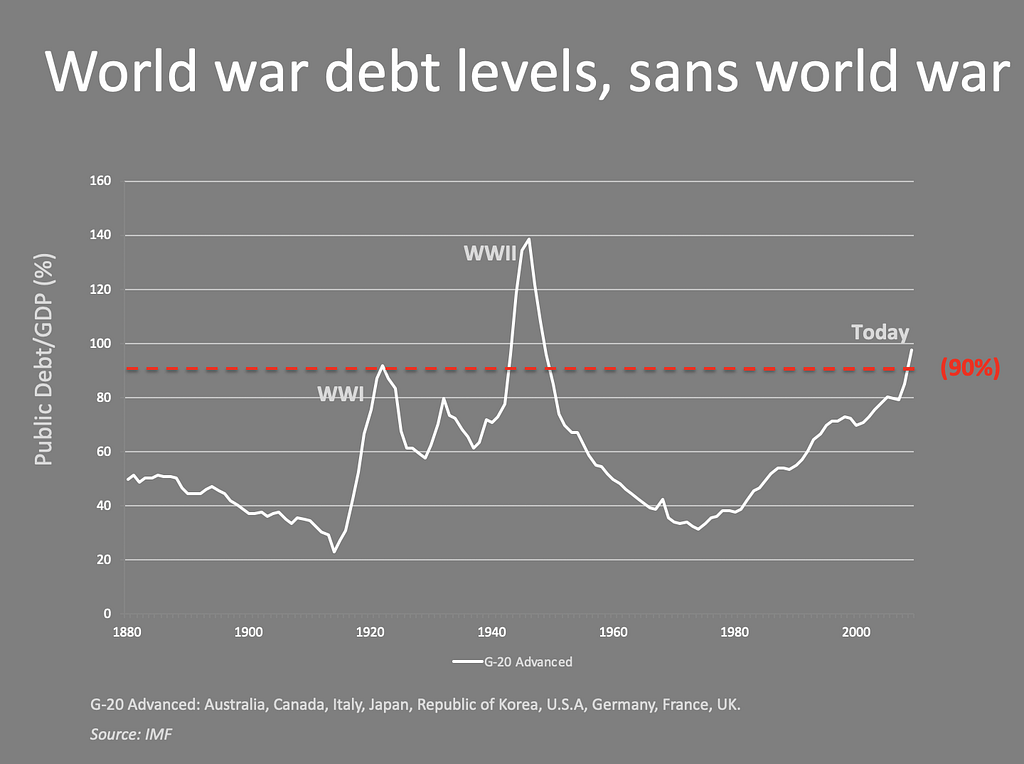
- Prior to COVID-19 we already had world war levels of public debt (Figure 10)
Figure 10: Many nations already had troubling world war levels of debt before COVID-19 emerged
While we anticipate a greater initial risk of financial instability in emerging markets, which are relatively more indebted than many advanced economies, we would caution against the view that advanced economies are immune from financial crisis.
For starters, there is significantly underreported or hidden exposure to emerging markets in many advanced economies. We are also starting to see a repeat of the credit downgrade cycle that lead to a downward credit spiral in advanced countries during the 2008 Great Financial Crisis. As Harvard Professor Ken Rogoff, co-author of “This Time Is Different: Eight Centuries of Financial Folly”, warned recently that we may be facing “the mother of all financial crises”.
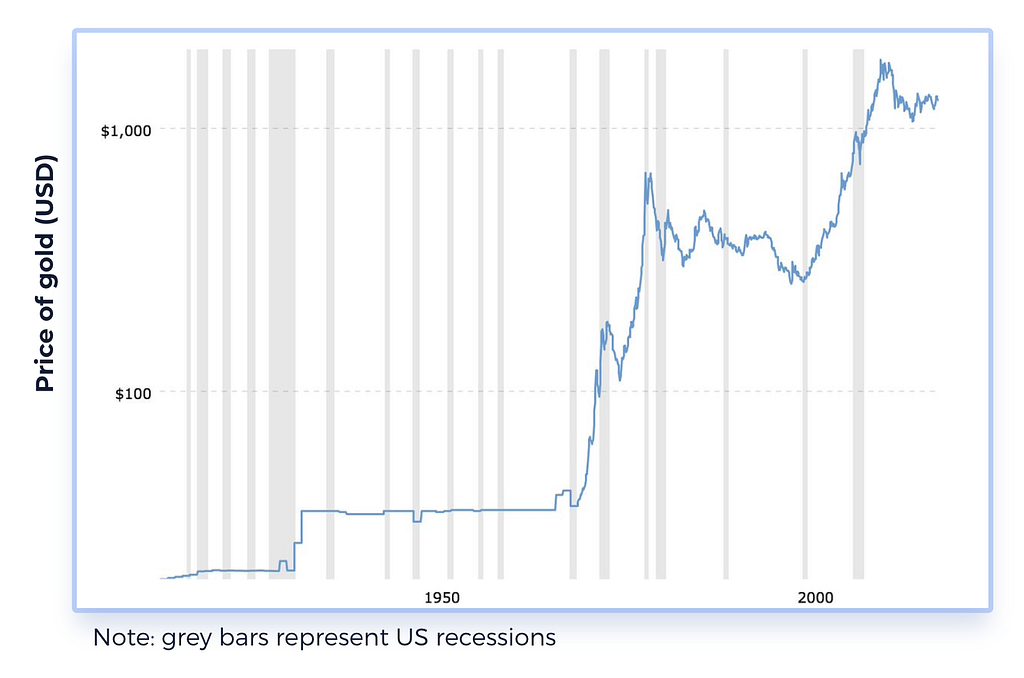
Few question that the global economy is already in recession, and another empirical fact we can reference is the strong performance of hard assets like gold in times of recessions (Figure 11).
Figure 11: Hard assets have often performed well during economic downturns and periods of financial instability
Last year we published our essay discussing the complementarity of gold and bitcoin as hard assets, and why we believe bitcoin is on some measures superior to gold. As a less mature and established asset, bitcoin features greater volatility. But in our view it also offers added functionality, favorable demographic interest, and more potential upside.
At the start of the 2008 financial crisis, gold matched the decline of equities, dropping 17% in October 2008 (Figure 12). Then as now, cash was king, with the US dollar seeing massive flows and appreciation in the early days of both crises.
Figure 12: Gold was no safe haven either at the start of both the 2008 and COVID-19 crises

However, as the scale of the fiscal and monetary response became clear gold began a sustained appreciation in 2009, finishing up 24% for the year (Figure 13). By 2011 it was up over 2x from its 2008 low, setting an all-time high close to $2,000 USD.
Figure 13: It was not long into the 2008 financial crisis before gold moved significantly higher, setting a new all-time high by 2011

With bitcoin’s drop last month and swift rebound off its 13 March low, BTC appears to be charting a course similar to gold in 2008–09. Gold is also performing similarly to how it performed in 2008, lending support to the case that hard assets may be one of the best performing assets for the current crisis.
History may not always repeat, but if often rhymes.
COVID-19: winners and losers
We discussed on our April markets call some of the broader winners and losers from COVID-19 beyond the many people who have lost or will sadly lose their lives and livelihoods (Table 2).
Table 2: COVID-19 Winners & Losers

Sources: Blockchain.com, Marginal Revolution, The Baseline Scenario, Liberty Street Economics
In crypto, one of the biggest early winners are stablecoins, which have seen their combined market value almost double in Q1 (Figure 14).
Figure 14: Combined market value of leading USD-pegged stablecoins
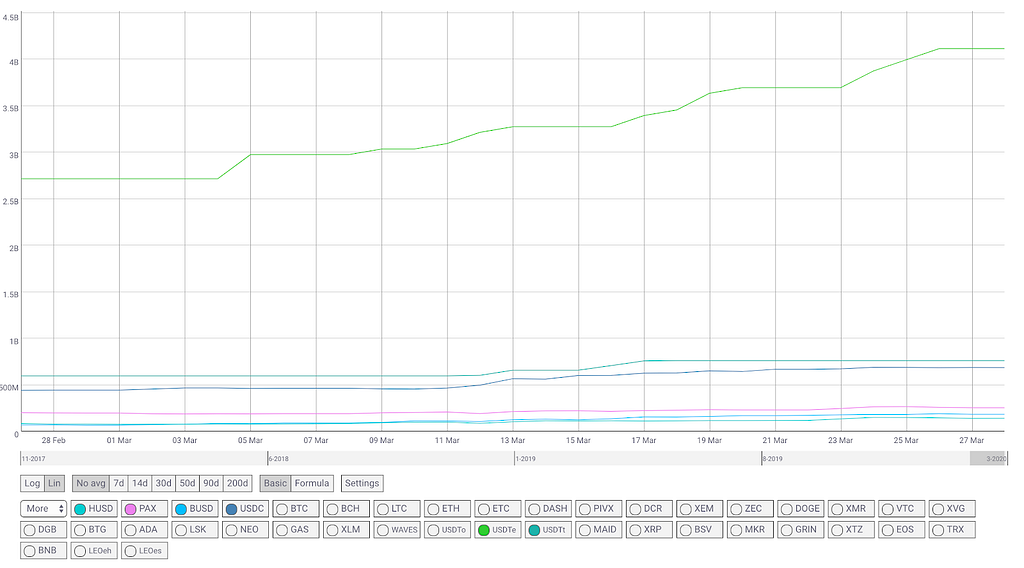
Source: CoinMetrics
Stablecoins are potentially useful outside of crypto markets during the COVID-19 crisis. For example, in emerging economies, where not everyone has easy access through their bank to US dollar deposits or physical US dollar banknotes, stablecoins allow emerging market firms and individuals to “dollarize”. If crisis dynamics continue to worsen in emerging markets we may see a dramatic further increase in the use of stablecoins.
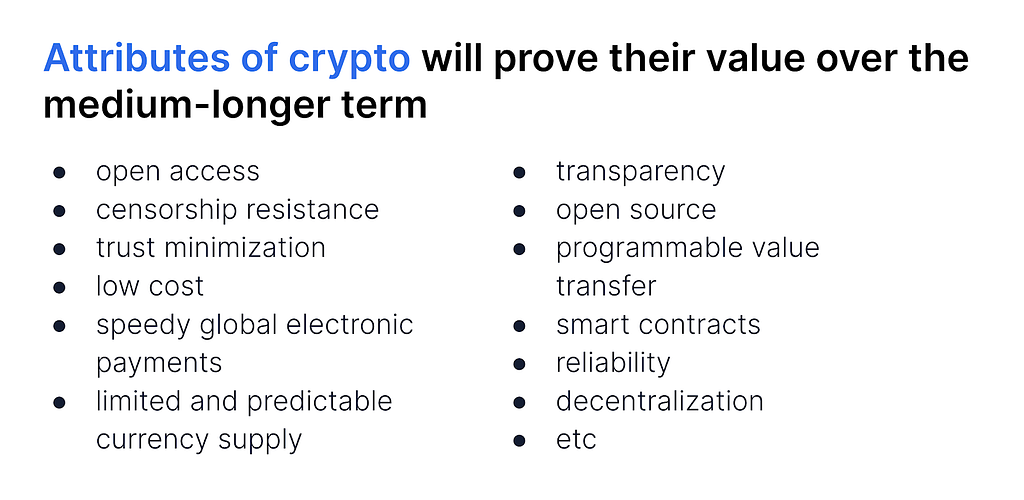
Looking further ahead, we believe the COVID-19 crisis will reinforce the tremendous value of crypto and blockchain technology.
To highlight just one specific example, several interesting projects with large consortiums are piloting decentralised industry networks including MediLedger, an open protocol for the pharmaceutical industry.
What we’re reading
Crypto-focussed
- Coin Metrics: State of the Network: Issue 42 — Data Shows Cryptoasset Sell-off Was Driven by Short-term Holders
- Pantera Capital: Crypto In This Crisis; Pantera CEO Dan Moorehead has more on Twitter here
- The Block: A Deep Data Dive into Bitcoin’s First Quarter of 2020
- Pomp Podcast: Preston Pysh Explains Why Bitcoin’s Volatility is a Feature, Not a Bug
Beyond crypto
- Centre for Economic Policy: Debt and financial crises: Will history repeat itself?
- Jonathan Tepper, Prevatt Capital: Covid-19 has exposed our financial fragility
- Ray Dalio: The Mechanics of the War Economy
Misc.
- This bitcoin advertisement is brought to you by the FDIC
- This bitcoin advertisement is brought to you by the Federal Reserve Bank of New York
For more insights from our research team, go to our Research page and follow our Head of Research, Garrick Hileman on Twitter.
Footnotes: Breakdown of Terminology
Footnote 1: An order book is a list of all outstanding bids and asks for an asset, organized by price level. Order books are filled with bids and asks by market makers, who place limit orders at price levels surrounding the mid price. Limit orders will not be executed unless the price of an asset equals the price specified in the order.
Footnote 2: The cumulative amount of bids and asks on an order book is called market depth. Market depth is closely associated with liquidity (the degree to which an asset can be quickly bought or sold on a marketplace at stable prices). If market depth is “deep” for an asset, this means that there is sufficient volume of open orders on either the bid or ask side, which ultimately makes it easier to exchange the asset at prices reflecting its intrinsic value. The weaker a market’s depth, the easier it is for larger market orders to move the price, a sign of an illiquid market.
Footnote 3: The counterparty to market makers are price takers, who place market orders — orders made at the prevailing price of an asset. Price takers ‘take’ orders off of an order book at an asset’s market price. A taker’s sell order will be filled by a maker’s buy order (a bid) and a taker’s buy order will be filled by a maker’s sell order (an ask).
Introducing the new Blockchain.com monthly newsletter — April Edition: “After the Dust Settles” was originally published in @blockchain on Medium, where people are continuing the conversation by highlighting and responding to this story.


